Smart Distribution Utility Strategies that Maximize Grid Efficiency
 |
| Modern Grid | Source: Schneider Electric |
The efficiency of electrical distribution is rarely planned or managed by utilities. The unfortunate result is that most utilities waste substantial amounts of electricity. In fact, annual electricity transmission and distribution losses average 5% in the European Union.1 2 That breaks into 24% for transmission and 76% for distribution losses, which represents 5 billion euros in energy wasted every year in distribution. This number includes losses in the medium and low voltage lines and in primary and secondary substations.
As a result of government mandates, distribution system operators (DSOs) will need to improve the efficiency (lower the loss rates) of their electrical distribution networks. In addition, they are tasked with finding new ways to integrate smart grid drivers such as electric vehicle charging stations and alternative energy generation (wind, solar) at consumer locations.
Today, thanks to smart strategies it is both possible and prudent to plan, measure, and improve transmission and distribution efficiency. Improvements can reduce operating costs by enabling the installation of equipment and software that communicates and integrates highly networked (connected) sensors and actuators throughout the distribution path.
Issues and Strategies
Issue 1: Technical Losses in MV Lines
In Europe, networks are configured in open loops and controlled in order to be able to isolate a fault and restore power (see Figure 1). The normal open points of the loops are strategically located to maximize the quality of service, i.e., low interruption duration (SAIDI) and low interruption frequency (SAIFI). However, this approach does not minimize losses.
 |
| Figure 1. Open Loop Network | Source: Schneider Electric |
Related Article: Substation Control System
Strategy: Advanced Distribution Management System
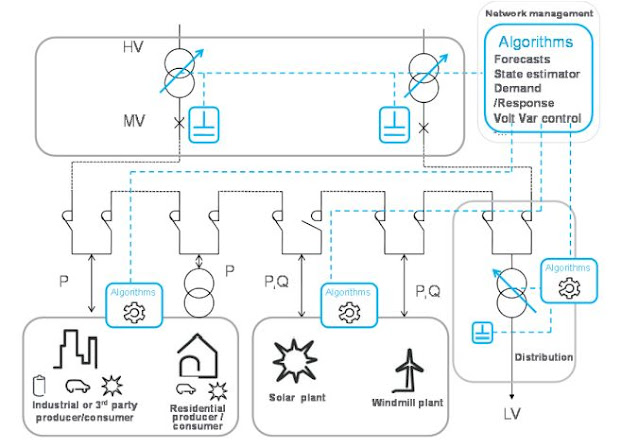
Systems built to estimate losses, like advanced distribution management systems (ADMS), need a real-time network topology, network measurements, load profiles at MV/LV substations, and customer consumption information to determine the optimal location of normal open points. In this environment, when the system operator plans to open or close a switch-disconnector, the ADMS simulates the impact on the reliability of supply, losses, and voltage management. Algorithms calculate optimum configurations on an hourly, monthly, seasonal, or yearly basis according to provided load curves, weather forecasts, real-time data coming from sensors, smart meters, and the number of switch operations (see figure 2)
 |
| Figure 3. Advanced Distribution Management System |
Issue 2: Impact of DER on Voltage Management
One of the main responsibilities of utilities around the world is to maintain voltage limits as agreed to via contract with their customers (i.e., within +/- 10% of the agreed-to target). Voltage control is traditionally performed by transformers, using on-load tap changers (OLTC) and capacitor banks that inject reactive power into the grid at the HV/MV substation level. The distribution system operator (DSO) fixes a setpoint and prepares scenarios and ranges based on seasonal load curves, for example.
As a result of the massive injection of distributed energy resources (DER) requirements onto the grid, voltage management presents DSOs with a major challenge. They now must manage situations where voltage may be rising on one part of their grid while decreasing on another part. Thus, DSOs are deploying sensors to monitor the voltage all along with feeders, new actuators that can regulate the voltage at different levels, and centralized or distributed intelligence to manage the macro voltage control.
Strategy: Fine-tuned voltage control infrastructure
The monitoring of MV equipment in older substations is costly as it requires complex, intrusive methods. Thus, the ability to acquire accurate, “real-time” voltage measurements requires the deployment of new solutions and sensors to minimize long-term global costs.
Related Article: Voltage and Reactive Power Compensation
A number of new solutions can be deployed to address this challenge, such as:
- New Capacitive or Resistive Voltage Dividers
- New RTU Generation
- New Smart Sensors
- Virtual Sensors
- Actuators
- Reactive Energy Injectors
 |
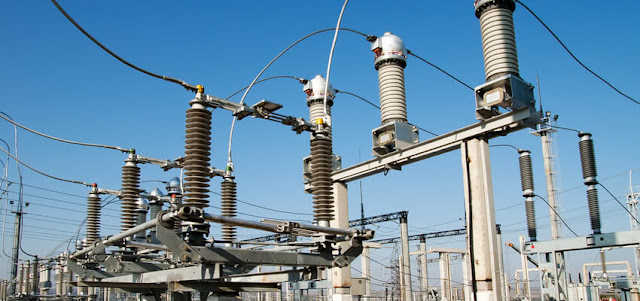
| Figure 4. RTU | Source: Schneider Electric |
LV incomers and LV feeders are equipped with energy meters connected to the RTU in the substation. The system can calculate and locate imbalances on LV feeders. The re-balancing of loads can be performed by field staff to switch a targeted customer from one phase to another. This particular LV monitoring allows the network to accommodate more DER since it addresses the issues of load imbalance and helps to reduce energy loss. The switch from one phase to another can be either regularly scheduled (e.g. once a year) or can be addressed on an ad hoc, case-by-case basis. Benefits of deployment include an estimated cost reduction fueled by reduced joules losses in cables of 200 to 800 euros per year and an improvement of the substation power output of up to 30%.
Issue 4: Non-technical loss identification
It is estimated that 90% of non-technical losses occur in LV networks. Losses are assumed to range between 1,000 to 10,000 euros per MV/LV substation per year in European countries. Therefore, LV networks are a top priority in terms of loss reduction. A first step in assessing the situation is to begin monitoring to determine how much loss is being incurred. In the past, LV networks were rarely monitored because, due to the high number of points to equip, monitoring was costly. Now, new approaches, architectures, and technologies allow for affordable and more precise monitoring.
Strategy: Smart Metering Deployment
Locating the sources of losses within the network is one of the first challenges. One solution for monitoring LV networks is to utilize smart energy meters as additional sensors to supply data regarding the energy performance of the network. Under this scenario, the first step would be to determine the proper location within the network of each of these meters. The next step would be to then equip each LV feeder with a meter. Care would have to be taken to install these meters without any outages to customers. It takes around one hour per substation to install the energy management meters.
 |
| Smart Meter Deployment |
Source:
- Smart Distribution Utility Strategies that Maximize Grid Efficiency.
- Authors: Jean-Yves Bodin, Renzo Coccioni, Luc Hossenlopp & Michel Sacotte
- Publisher: Schneider Electric | Download

.webp)


No comments: